Archives de catégorie : Supervision

Check_MK agent for Esp Easy (updated)

Here is Check_MK agent for ESP Easy.

The ESP Easy firmware can be used to turn the ESP module into an easy multifunction sensor device for Home Automation solutions like Domoticz. Configuration of the ESP Easy is entirely web based, so once you’ve got the firmware loaded, you don’t need any other tool besides a common web browser.

Quick Howto:

Download the agent package from Check_MK Exchange

  • Install the agent.
  • Create a new device in check_mk, with agent type = Check_MK Agent
  • Create a new rule « Individual program call instead of agent access » for this host and set path to
 ~/local/share/check_mk/agents/check_mk_agent.espeasy <IP>

  • Then, create your devices in ESP Easy (an Ultrasonic Sensor for example) :

  • Launch a scan, your sensors will appear, as well as device Uptime and Free RAM:

You can also monitor system values of ESP8266 (RSSI, VCC Value, …) by adding « System Info » devices on EspEasy.

Enjoy !

Update 2020/01 : This agent worked only for ESPeasy 1.x versions. The output format changed with ESPEasy 2.x. The agent version 2.0 now supports ESPEasy 2.x as well as older versions.

check-mk « check_pid »

This local check for check_mk is useful with services who won’t start if an old or incorrect pid file remains. I needed to write it because this is the very case of the postfix version embedded with zimbra.

The code is self-explanatory :


#!/bin/bash
# Cyril Pawelko http://www.pawelko.net/check-mk-check_pid/
# Version 1
# Checks if the PID referenced in a PIDFILE exists
# This is a "local" check_mk check for *NIX:
# - Rename it if you need several checks on the same host
# - Copy to check-mk local checks directory (/usr/lib/check_mk_agent/local on Debian)
# - Customize with the PID file path:
PIDFILE="/opt/zimbra/data/postfix/spool/pid/master.pid"

if [ ! -r $PIDFILE ]
 then echo 3 Pid_$PIDFILE - File $PIDFILE cannot be read
 exit
fi

PID=$(cat $PIDFILE  )
PID=${PID//[^0-9]/}
if ps $PID > /dev/null
 then echo 0 Pid_$PIDFILE - Process $PID referenced in $PIDFILE is running
 else echo 2 Pid_$PIDFILE - Process $PID referenced in $PIDFILE does not exist
fi

Download

Have fun !

Check_mk check for generic OID

A while ago, I wrote a simple check_mk check to monitor a single SNMP OID. I can simply be customized to quickly monitor any value, with alert levels and perfdata. Here it is :

#!/usr/bin/python
# -*- encoding: utf-8; py-indent-offset: 4 -*-

# Cyril - 28/01/2014
# Check_snmp_template for a single OID, for example .1.3.6.1.2.1.4.5.0
# How to customize :
# Break the OID in 2 parts, for instance ".1.3.6.1.2.1.4.5" and "0". Adapt baseoid and suboid.
# Adjust crit and warn values
# Replace "snmp_oid_test1" in all strings and function names
# Remplace "valeur" with a description

# OID to check
baseoid = ".1.3.6.1.4.1.6486.800.1.2.1.16.1.1.1.13"
suboid = "0"
# Warn if above this value
warn = 70
# Critical if above this value
crit = 90
# OID description (for example: CPU Utilization)
valeur = "Valeur"

def inventory_snmp_oid_test1(info):
    if len(info) > 0:
        return [ (None, (warn, crit) ) ]

def check_snmp_oid_test1(item, _no_params, info):
   value = int(info[0][0])
   perfdata = [ ("valeur", value, warn, crit) ]
   if value > crit:
           return (2, "Valeur: %i" % value, perfdata)
   elif value > warn:
           return (1, "Valeur: %i" % value, perfdata)
   else:
           return (0, "Valeur: %i" % value, perfdata)

check_info["snmp_oid_test1"] = {
        "check_function"        : check_snmp_oid_test1,
        "service_description"   : "Alcatel Switch CPU",
        "snmp_info"             : ( baseoid, [ suboid ] ),
        "has_perfdata"          : True,
        "inventory_function"    : inventory_snmp_oid_test1,
        }

# Quick and dirty scan function, testing against sysObjectID would be more efficient
snmp_scan_functions["snmp_oid_test1"] = \
        lambda oid: oid( baseoid + "." + suboid ) != None

Download it here : check_mk_generic_snmp_oid

Dell Storage Compellent SC plugin for check_mk

I wrote a check_mk check for Dell « Compellent » Storage Arrays.

It was developped for the SC4020 model, and works also for SCv2000/SCv2020 (thanks Emmanuel) and SC7020. It should work with other models (SC5020, SC8000, SC9000).

The following items can be monitored:

  • Global status, as reported by the system
  • Controllers status
  • I/O modules status
  • Disk status
  • Hardware sensors status
  • Temperatures (with performance data)
  • Power supplies status
  • Volume status
  • Servers status

sc4020_check_mk

Download from Check-MK Exchange

Have fun !

Update 27/06/2017 : Since SCOS 7.x, temperature values are not correctly reported through SNMP. This caused a crash of the temperature checks.This is a known bug which will be addressed with SCOS 7.2.10. Meanwhile, I’ll release version 1.1, containing workarounds to avoid crashes.

Agent check_mk pour Freebox Server

MAJ 08/06/2014 : Enfin packagé sous forme de fichier MKP

MAJ 25/08/2014 : Nouvelle version 1.2 : Correction d’un bug si pas de freeplug (merci à Sylvain Lemoine). Correction bug sur état des interfaces réseau.

MAJ 06/04/2015: Version 1.4 : Correction d’un bug si un le nom d’un périphérique connecté en wifi comporte un accent (merci encore Sylvain !). Meilleure remontée des traces même en mode debug.

MAJ 24/03/2016 : Version 1.5 : Meilleure gestion d’une erreur rencontrée avec une freebox neuve.

MAJ 04/11/2016 : Version 1.6 : Meilleure gestion d’une erreur rencontrée quand le dernier Freeplug est déconnecté.

MAJ 18/02/2018 : Version 1.8 : Le calcul d’uptime générait parfois des erreurs, il est désormais basé sur uptime_val, qui a été créé à ma demande.

MAJ 18/11/2020 : Version 2.1 : Passage sur l’APIv2 du wifi pour éviter une erreur sur une freebox neuve, et correction de la détection de l’état de l’interface ethernet des boitiers CPL tiers.

MAJ 25/08/2023 : Version 2.3.0 : Support des connexions de type FTTH (validé avec boitier ONU uniquement, statistiques limitées)

Le serveur de la Freebox Révolution (v6) n’est pas accessible via SNMP, ce qui rend les possibilités de supervisions bien ternes, alors que ce boitier gère en réalité de nombreuses opérations.
Courant 2013 l’API REST a été mise à jour, elle permet d’interroger de nombreux compteurs concernant la freebox.

Voici un script python qui fait office d’agent pour la solution de supervision check_mk. Pour ceux qui ne connaissent pas, c’est du Nagios sans les inconvénients de Nagios, les parties les plus rébarbatives étant remplacées par des scripts et une interface web efficaces.

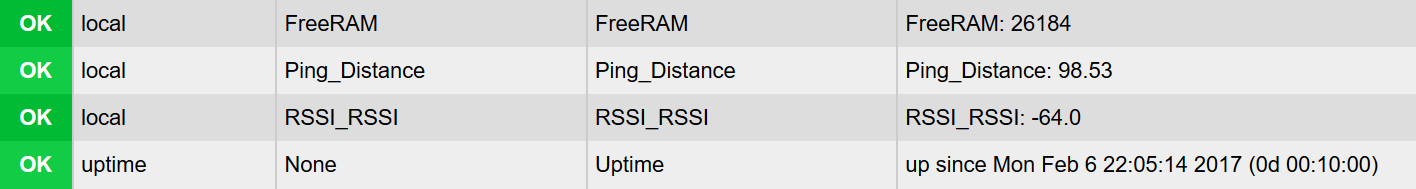
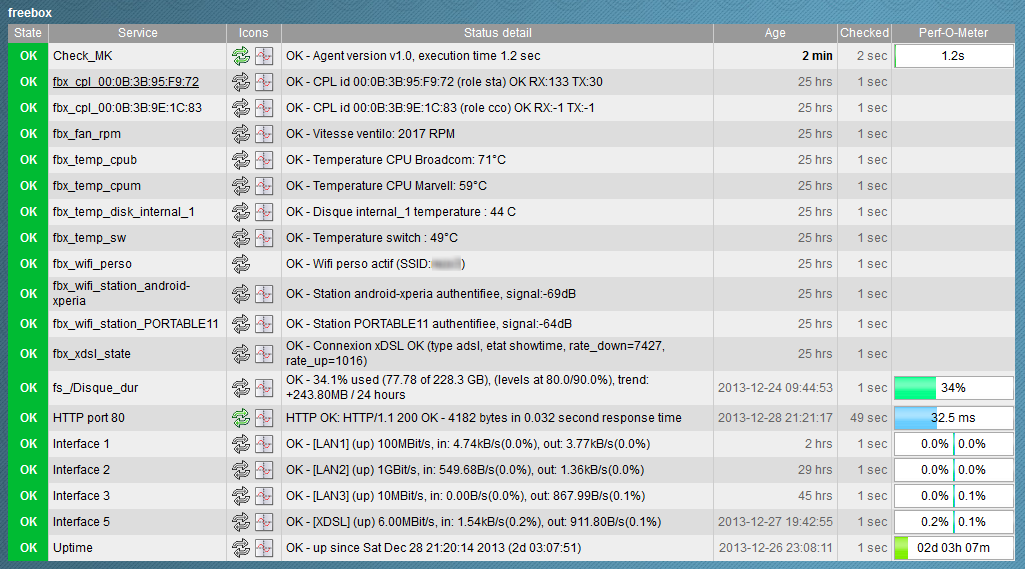
Cet agent permet l’inventaire, la supervision et la création de graphiques pour les éléments suivants:

  • Freeplugs et autres équipements CPL
  • Température des processeurs, du switch et du disque
  • Vitesse du ventilateur
  • Activation du wifi
  • Connexion et force du signal des stations wifi
  • Espace libre des partitions
  • Statistiques sur les 4 interfaces du switch (état, trafic, vitesse)
  • Etat de la connexion ADSL (et probablement VDSL) et FTTH
  • Erreurs ADSL
  • Uptime

Je pense avoir intégré tout ce qui était possible.
Cependant:

  • C’est mon premier essai en python, le code n’est pas des plus sexys
  • La gestion des erreurs sur les ports de switchs n’est pas complète

Pour l’installer, suivre la procédure suivante:

  • Installer le module « python request » (sur Debian: apt-get install python-requests)
  • Télécharger le fichier MKP sur Check MK Exchange
  • Se logger avec l’utilisateur exécutant nagios (ou l’instance d’OMD)
  • L’installer avec la commande « cmk -P install freebox-v6-2.3.0.mkp »
  • Repérer l’emplacement du script installé avec la commande « cmk -P list freebox-v6 »
  • Lancer le script avec l’option « -a » pour lancer la procédure d’authentification sur la freebox
  • Autoriser l’application sur l’afficheur LCD du freebox server
  • Ouvrir ensuite une session sur l’interface web du freebox server, aller dans « Paramètres / Gestion des accès / Applications » et donner le droit « Modification des réglages de la freebox » à l’application
  • Relancer manuellement le script, sans option, et vérifer que la sortie ait l’air correcte. Pour (beaucoup) plus de détails, ajouter l’option -v
  • Via WATO, ajouter un hôte Freebox avec l’IP LAN de la Freebox
  • Toujours via WATO, ajouter une règle de type « Datasource Programs / Individual program call instead of agent » pour l’hôte correspondant à la freebox
  • Indiquer le chemin complet du script, sans paramètre supplémentaire
  • Appliquer la configuration de WATO
  • Lancer un inventaire des services via WATO, sélectionner les services désirés et appliquer la configuration
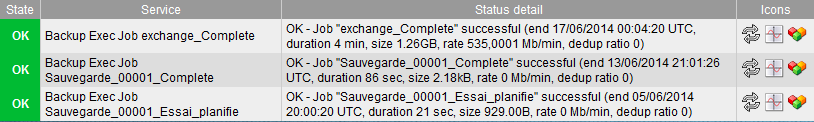
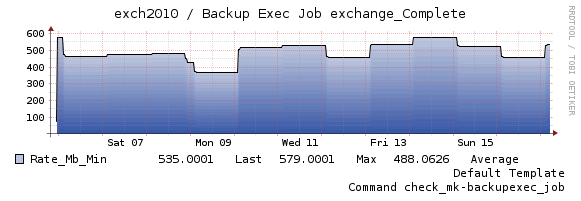
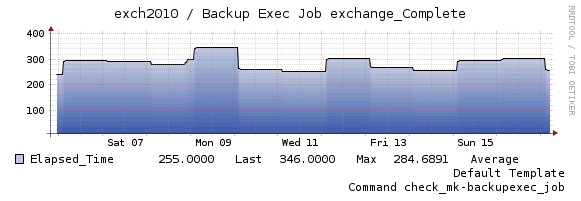
  • Et hop :

nagios_freebox

Notez aussi que:

  • L’IP LAN de la Freebox n’est pas utilisée par le script (mais mafreebox.freebox.fr), mais Nagios pingera cette adresse pour vérifier l’état de l’hôte
  • Il est possible d’utiliser l’option -v pour avoir une sortie (très) détaillée ce qui se passe
  • Il est possible d’utiliser l’option -d pour logger cette sortie détaillée dans /tmp/check_mk_agent_freebox_revolution.log

Pour les curieux, cet agent utilise si possible le format standard de l’agent check_mk linux, et sinon des checks locaux.
Si vous préférez cacti, voir http://glr81.free.fr/blog/index.php?2013(..)

Reste à faire

S’il reste encore des gens motivés dans la salle, il reste à :

  • Créer des templates pnp4nagios, notamment pour l’ADSL
  • Gérer correctement les erreurs sur interfaces du switch (écrire un vrai plugin check_mk ?)
  • Compléter le package mkp, avec une page man, des perf-o-meter et tout et tout

Télécharger

Disponible sur Check_MK Exchange

Backup Exec plugin for check_mk

This check_mk plugin queries Backup Exec database to find job history, and returns the state of the last job execution.

It has been tested with Backup Exec 2010 and 2012, and should work with previous versions from 9.0 to 12.5. Backup Exec 2010 is required (see below)

checks

It has been tested on Windows 2008 R2, and should work on Windows 2012, and maybe Windows 2003 if powershell is installed.
Contrary to many Backup Exec plugins for Nagios, it is not a compiled executable but a simple powershell script, and doesn’t parse xml history files and so runs very fast.
It tries to connect on the local MSSQL instance named BEDB, which is the default configuration. In most cases, no configuration is needed, just copy backupexec_job.ps1 into check_mk « plugins » subdirectory.

The following performance data is returned to create graphs: Job size, duration, rate and deduplication ratio.

graph_backup_rate

graph_backup_time

Download from Check-MK Exchange

16/07/2014 : Version 1.1 – Added support for job status 9 (missed)

28/07/2014 : Version 1.2 – Added WATO plugin to treat jobs ‘completed with exceptions’ as OK

29/07/2014 : Version 1.3 – Added support for job status 21 (canceled, timed out)

02/04/2015 : For Backup Exec 12.5, you need to use backupexec_9-12.5_job on your windows server (thanks Guillermo).

25/06/2015 : Version 1.4 – Fixed error « “Check parameter definition for backupexec_job has type Dictionary, but match_type None” » with check_mk 1.2.7i (thanks Jörg !). Version 1.4 doesn’t work anymore with 1.2.6 or previous versions. Use backupexec_job-1.3 instead.

02/09/2015 : Version 1.5 – Fixed compatibility with both check_mk<=1.2.6 and check.mk>=1.2.5 (thanks Peter & François)

07/10/2015 : Version 1.6 – Fixed « ERROR: Skipping invalid manpage: backupexec_job (Catalog info missing) » in 1.2.7i3 (thanks to Daniel Müller)

Decodeur Altitude Meteotime 323

Hideki est un constructeur de station météos en marque blanche.
La station Hideki DV323 se retrouve vendue sous différentes marques, notamment:

Cette station possède une sonde thermomètre/hygromètre communiquant via RF433.
Mon objectif était de capter et décoder ce signal pour le traiter sur un PC.
Il existe de nombreux projets Arduino allant dans ce sens, semblables à celui-ci.
Le protocole Hideki est connu et décodé, mais ce n’est manifestement pas celui utilisé par la station Meteotime.

Je me suis donc fortement inspiré de cette page afin de décoder le signal.

Une capture via la carte son m’a permis d’identifier un signal « propre » :

meteotime-signal-1

et, en zoomant, d’identifier les caractéristiques du signal :

meteotime-signal-2

soit une période d’environ 1220 µs.
Parfait : J’avais 64 bits utilisables.
Je suis donc parti du principe qu’un 0 était plus longtemps « en haut » qu’un 1 :

0: |---|_  : 839 µs - 362 µs
1: |-|___  : 362 µs - 839 µs

Afin de faciliter le travail, j’ai écrit un bout de code Arduino qui, avec le montage de PracticalArduino, a permis d’effectuer différents relevés.

J’ai ainsi pu identifier les bits significatifs :

                                       |> >> | >>>  |>>>        |> >> | >>>
                                       dd dd t ttt  TTTT        hh hh H HHH
       0123 4567 8901 2345 6789 0123 4567 8901 2345 6789 0123 4567 8901 2345 6789 0123
       0           1            2           3            4           5            6

Où:

  • dddd : valeur décimale de la température
  • tttt : température (unités)
  • TTTT : température (dizaines)
  • hhhh : hygrométrie (unités)
  • HHHH : hygrométrie (dizaines)

Exemple :

       0000_0000 0000_0001 1000_1000 0101_0010 1001_0100 1011_1111 0011_0101 1000_1000 22.2°C 53%

Les autres bits sont toujours identiques, on y retrouve probablement l’identifiant de l’émetteur et du bourrage.
Il me reste à identifier le bit pour les températures négatives, on verra cet hiver 😉

Mise à jour 27/07/2014 : Mon émetteur a rendu l’âme il y a bien longtemps, je n’ai jamais finalisé le code.
Le voici donc en l’état :
Code Arduino Meteotime RF

Il est fonctionnel, le montage est un récepteur RF433 Arduino classique

Cacti simple oid

I used to play with cacti, creating my own scripts, data input methods, data sources, graphs items and then graphs, but it was long way to obtain a single graph.

A smarter way is to use « SNMP – Generic OID Template » that appeared in cacti.
Let’s see an example : I want to graph the number of spams I’ve received during the last 24 hours. Counting is easy, I’ve just to find all files more recent than 24 hours in my IMAP folder « spam » (spamassassin does a very good job !). But I had to face security considerations, because apache user had to access my maildir !

It’s much simpler to expose this number via snmp, and then to create a simple graph based on Cacti « Generic OID » template. Note that SNMP is only accessible from my LAN, and the number of spams I’ve received is not very sensitive data. So let’s go:

  • Create the script /usr/local/bin/countspam.sh
#!/bin/sh
PATH=/usr/local/sbin:/usr/local/bin:/usr/sbin:/usr/bin:/sbin:/bin
find /home/cyril/Maildir/.SPAM/cur/ -ctime -1 | wc -l
  • Configure snmpd.conf to run this script and return the result
# Extensible sections.
exec .1.3.6.1.4.1.15555.1 countspam.sh /usr/local/bin/countspam.sh
  • Test the query. Note that the interesting value is .1.3.6.1.4.1.15555.101.1
root:/etc # snmpwalk -c public -v2c localhost .1.3.6.1.4.1.15555.1
SNMPv2-SMI::enterprises.15555.1.1.1 = INTEGER: 1
SNMPv2-SMI::enterprises.15555.1.2.1 = STRING: "countspam.sh"
SNMPv2-SMI::enterprises.15555.1.3.1 = STRING: "/usr/local/bin/countspam.sh"
SNMPv2-SMI::enterprises.15555.1.100.1 = INTEGER: 0
SNMPv2-SMI::enterprises.15555.1.101.1 = STRING: "40"
SNMPv2-SMI::enterprises.15555.1.102.1 = INTEGER: 0
SNMPv2-SMI::enterprises.15555.1.103.1 = ""
  • Connect to cacti console, click « New graph », select your host and « SNMP – Generic OID Template »
  • Enter the title, OID .1.3.6.1.4.1.15555.101.1 and choose a (fun) color
  • Your graph is now ready :

spam-count

hddtemp template for cacti

I’ve made a template to query hddtemp deamon and graph disks temperature.
Tested with cacti 0.8.6h on fc5, debian and gentoo. It uses only php core functions, no extra librairies are needed.

graph_image.php

INSTALLATION :

  • Install and configure hddtemp daemon
  • Test it with « telnet <host> 7634 » from your cacti box
  • Output should be similar to :

"|/dev/hda|IBM-DJNA-371350|47|C||/dev/hdc|Maxtor 6Y080L0|44|C|"

  • Copy hddtemp.xml to resources/script_queries directory
  • Copy hddtemp.php to scripts directory
  • Import template file cacti_template_linux_hddtemp_disk_temperature.xml
  • Add « Linux – hddtemp – disk temperature » data query to your host
  • Create new graph for this host and select disks

GROUPING GRAPHS :

If you want to group several disks on the same graph :

  • Import cacti_graph_template_linux_hddtemp_disk_temperature_2x.xml or cacti_graph_template_linux_hddtemp_disk_temperature_9.xml templates
  • Create a graph for each disk as described above
  • Create a graph for your host using 2x or 9x template, let fields empty
  • Edit the graph and select data sources previously created
  • You can delete single-disk graphs but not data sources

NOTE : You need exactly 2 or 9 disks, or you’ll have to modify the template.

DOWNLOAD : cacti-linux-hddtemp-1.0.tar.gz