I used to play with cacti, creating my own scripts, data input methods, data sources, graphs items and then graphs, but it was long way to obtain a single graph.
A smarter way is to use « SNMP – Generic OID Template » that appeared in cacti.
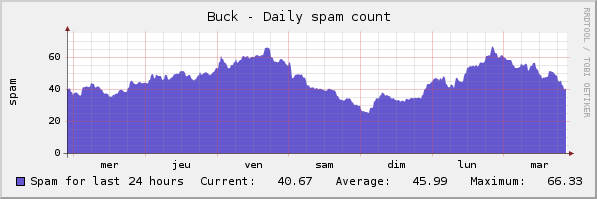
Let’s see an example : I want to graph the number of spams I’ve received during the last 24 hours. Counting is easy, I’ve just to find all files more recent than 24 hours in my IMAP folder « spam » (spamassassin does a very good job !). But I had to face security considerations, because apache user had to access my maildir !
It’s much simpler to expose this number via snmp, and then to create a simple graph based on Cacti « Generic OID » template. Note that SNMP is only accessible from my LAN, and the number of spams I’ve received is not very sensitive data. So let’s go:
- Create the script /usr/local/bin/countspam.sh
#!/bin/sh
PATH=/usr/local/sbin:/usr/local/bin:/usr/sbin:/usr/bin:/sbin:/bin
find /home/cyril/Maildir/.SPAM/cur/ -ctime -1 | wc -l
- Configure snmpd.conf to run this script and return the result
# Extensible sections.
exec .1.3.6.1.4.1.15555.1 countspam.sh /usr/local/bin/countspam.sh
- Test the query. Note that the interesting value is .1.3.6.1.4.1.15555.101.1
root:/etc # snmpwalk -c public -v2c localhost .1.3.6.1.4.1.15555.1
SNMPv2-SMI::enterprises.15555.1.1.1 = INTEGER: 1
SNMPv2-SMI::enterprises.15555.1.2.1 = STRING: "countspam.sh"
SNMPv2-SMI::enterprises.15555.1.3.1 = STRING: "/usr/local/bin/countspam.sh"
SNMPv2-SMI::enterprises.15555.1.100.1 = INTEGER: 0
SNMPv2-SMI::enterprises.15555.1.101.1 = STRING: "40"
SNMPv2-SMI::enterprises.15555.1.102.1 = INTEGER: 0
SNMPv2-SMI::enterprises.15555.1.103.1 = ""
- Connect to cacti console, click « New graph », select your host and « SNMP – Generic OID Template »
- Enter the title, OID .1.3.6.1.4.1.15555.101.1 and choose a (fun) color
- Your graph is now ready :